Post Demonetization Dynamics of Currency Composition in India
Kanhaiya Singh
Kanhaiyasingh.in@gmail.com
(Views Expressed are Personal)
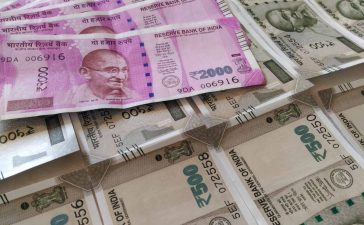
Currency composition in India is moving towards a balanced one. Trends in data published by the Reserve Bank of India indicates a systematic contraction of the share of the currency with denomination of INR 2000. The purpose of this high denominated currency introduced during demonetisation was probably to help replace the 1000 and 500 denominated currency notes quickly. However, several commentators felt that the introduction of 2000 denominated currency would help storage and movement of black money. Therefore, it is desirable to reduce the share of such high denominated currency from circulation.
Although the Government has denied any intension to withdraw the highest denominated currency note from circulation, the data on currency composition has some indication that the 2000 denominated currency is being withdrawn systematically (Table 1 and Figure 1). If this is true then, our guess is that, at some level of its stock with public, the circulation of INR 2000 denominated currency through banking channel would be reduced to almost zero. People would minimise cash deposits in banks in this denomination of currency. This would indicate either a kind of hording of the highest denominated currency or circulation of the same in informal transactions instead of banking channels. If this is established, then it may be appropriate at that point of time to discontinue INR 2000 denominated in short notice.
.
|
Table 1: India's Currency Composition by Value of Denominations (Rupee) |
||||||
|
Year |
<100 |
100 |
200 |
500 |
1000 |
2000 |
|
2010-11 |
6.3 |
14.8 |
0.0 |
46.9 |
31.9 |
0.0 |
|
2011-12 |
6.1 |
13.2 |
0.0 |
48.1 |
32.5 |
0.0 |
|
2012-13 |
5.9 |
12.2 |
0.0 |
45.4 |
36.4 |
0.0 |
|
2013-14 |
5.7 |
11.4 |
0.0 |
43.8 |
39.1 |
0.0 |
|
2014-15 |
5.6 |
10.4 |
0.0 |
45.3 |
38.8 |
0.0 |
|
2015-16 |
5.3 |
9.5 |
0.0 |
47.2 |
38.0 |
0.0 |
|
2016-17 |
9.2 |
18.9 |
0.0 |
22.0 |
0.7 |
49.2 |
|
2017-18 |
6.4 |
12.1 |
2.0 |
42.3 |
0.4 |
36.8 |
|
2018-19 |
5.7 |
9.4 |
3.7 |
50.4 |
0.0 |
30.8 |
|
2019-20 |
4.9 |
8.1 |
4.4 |
60.1 |
0.0 |
22.4 |
Date |
: |
2020-09-01 |
Sector |
: |
Money and Finance |
Source |
: |
CGDR Research |
- Post Demonetization Dynamics of Currency Composition in India
- Shadow of COVID-19 on World Economy
- Status of Unaccounted Income/Wealth both inside and outside the Country - A Critical Analysis
- National Education Policy 2020
- Towards Solving Housing Problems of Migrant Workers & Slum Rehabilitation
- Military Expansion of China in Pakistan
- China surpasses U.S. to become largest world economy
- The Reserve Bank of India released the final Guidelines for implementation of Bharat Bill Payment System (BBPS).
- Global Growth Disappoints, Pace of Recovery Uneven and Country-Specific


